
U.S.
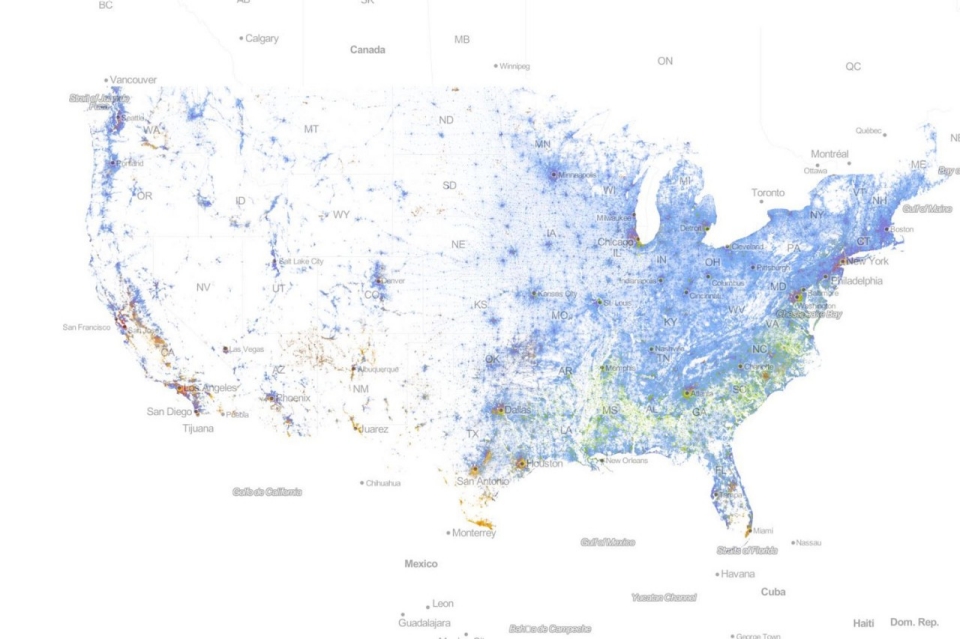


Map Legend: Blue dots: white Americans, Green dots: African-Americans, Yellow dots: Latino-Americans, Red dots: Asian-Americans, Brown dots: Native-Americans/Other
A new map that compiles demographic data from the 2010 Census shows just how much the United States remains segregated by race. The map, created by Dustin Cable at the University of Virginia, is made up of over 308 million dots that are separated by race – one for each person included in the April 2010 U.S. Census.
"If we put all the dots together, what we end up with is a striking mosaic of the racial demographic of the country," Cable told Al Jazeera. "Even if segregation is better then what it was, it doesn't mean we no longer have to worry about it."
The map seperates every person by race: white Americans are blue dots, African-Americans are green, latino Americans are orange, Asian-Americans are red, and other races such as Native American are brown.
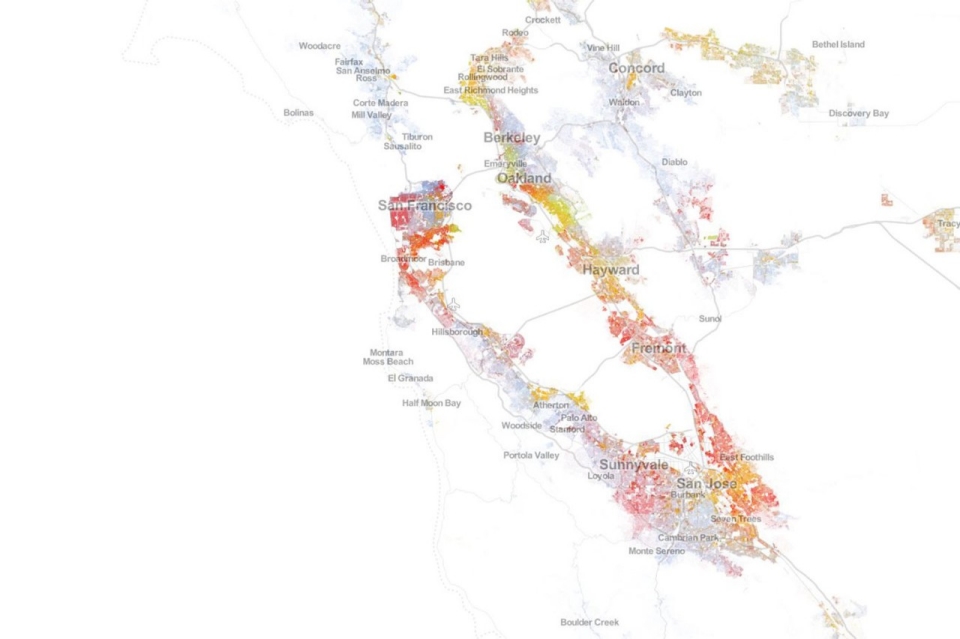
Cable says the map challenges the commonly-held notion that the America's large cities are bastions of racial integration.
"They may seem racially integrated from a far wide zoom level, but once you get closer," cable says, the cities are still fairly segregated.
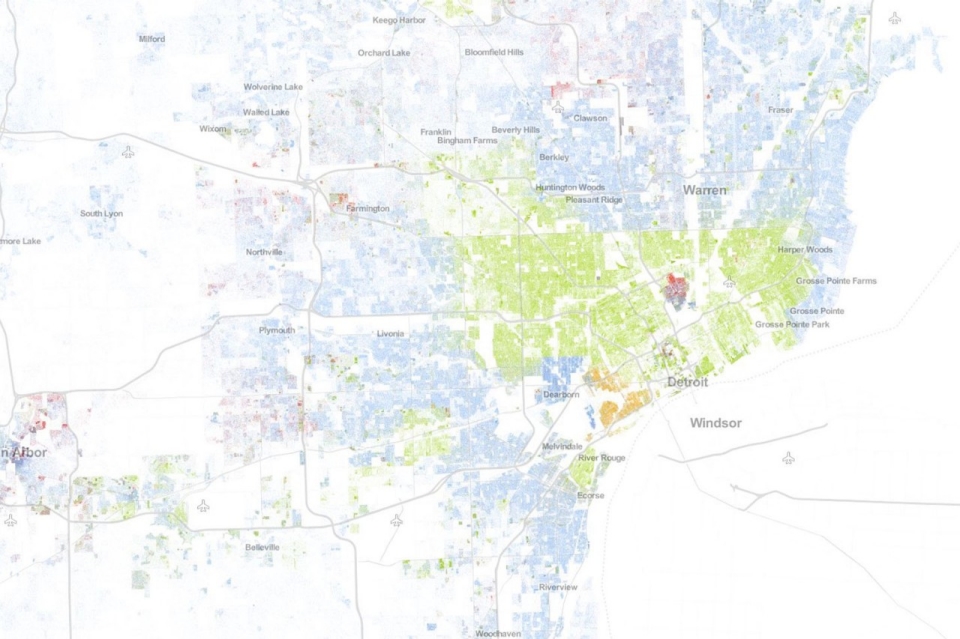
One glaring example of segregation can be found in Detroit, a city that has seen its population decrease by 25 percent and is fighting for its survival. Detroit's black and white population is almost entirely separated along the famous 8 Mile Road, with nearly all of the city's black residents on one side and whites on the other.

"One of the concerns scholars have about residential segregation is whether or not it is indicative of (or the cause of) differences in economic opportunity, educational attainment, social mobility, and overall well-being," Cable said in an email to Al Jazeera.
"For example, does a school system in a predominately African-American neighborhood provide the same quality of education and opportunities as a nearby district with predominately white residents? Because poverty is more prevalent among minority groups, do concentrations of poverty in segregated urban areas lead to dilapidated housing, health hazards, violence, or other ill-effects? Or, rather, does segregation cause the poverty in the first place? These are important questions to ask on this subject."
Cable also says it's important to consider the societal impact of people only mingling with people of their own race, political affiliation or educational level. Earlier this month a Reuters/Ipsos poll revealed that about 40 percent of white Americans and 25 percent of non-whites have friends that are exclusively of the same race.
The poll revealed that interaction among races is more common among Latinos, where only a tenth don't have friends of another race. Nearly half of all Latinos that have a spouse or partner are in a relationship with a non-Latino, a significant contrast to a tenth of whites and blacks, though experts say that separation among blacks and whites has historical context behind it.
"This country has a pretty long history of restriction on inter-racial contact and for whites and blacks, even though it's in the past, there are still echoes of this," Ann Morning, an associate professor in the department of sociology at New York University, told Reuters. "Hispanics and Asian Americans have traditionally had less strict lines about integrating."
While the map and the Reuters poll show America is still a racially segregated country, racial issues are a lesser concern for younger generations. About a third of Americans under 30 who have a spouse or partner are in a relationship with someone of a different race, compared to a tenth of those over 30. Only one in 10 adults under 30 say that no one in their family, circle of friends or among their coworkers is of a different race.
"Attitudes regarding race have changed dramatically with each succeeding generation. And I think the rise of multi-racial identification and inter-racial marriages," contributes to that, Cable said.
The map comes at an interesting time for the United States. As more data is unpacked from the 2010 Census, it consistently points to a browner, more diverse America with whites in the minority by 2043. While the country is still majority-white, Census data also indicates that more white Americans are dying than are being born each year, and that Latinos will be the nation's largest minority.
With Al Jazeera and wire services


Error
Sorry, your comment was not saved due to a technical problem. Please try again later or using a different browser.