
U.S.
Universal Images Group / Getty Images
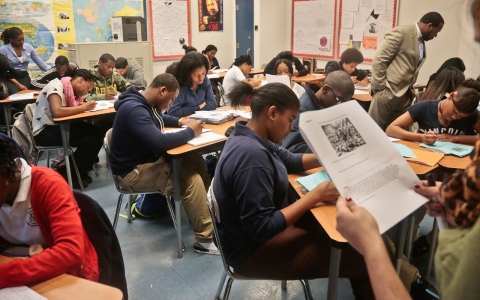
Handing out dismal grades on Wednesday, the Nation's Report Card said America's high school seniors lack math and reading skills critical in an increasingly competitive global economy.
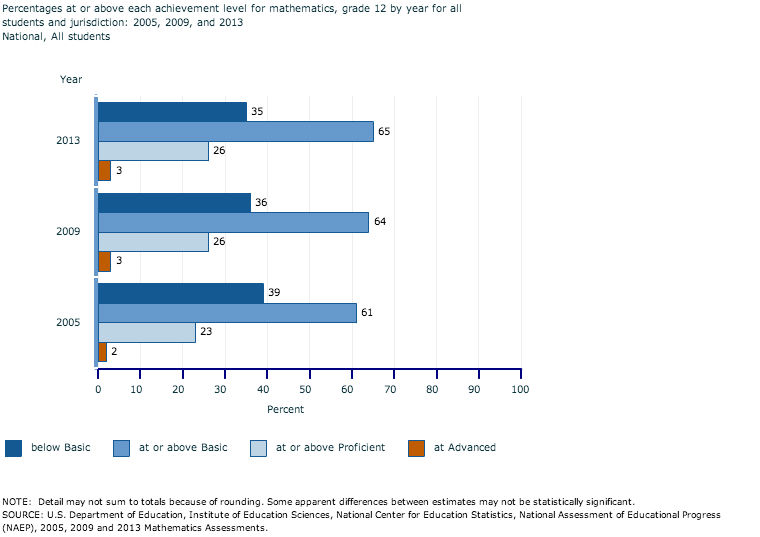
Only about one-quarter are performing proficiently or better in math and just 4 in 10 in reading. And they're not improving, the report says, reinforcing concerns that large numbers of today's students are unprepared for either college or the workplace.
Scores on the 2013 exam in both subjects were little changed from 2009, when the National Assessment of Educational Progress was last given to 12th graders. The new results come from a representative sample of 92,000 public and private school students.
The report follows the just-released and seemingly more encouraging research that U.S. high school graduation rates in 2012 reached 80 percent, a record.
One possible explanation is that lower-performing students who in the past would have dropped out of school are now remaining in the sampling of students who take the exam, said John Easton, acting commissioner of the Education Department's National Center for Education Statistics.
Wednesday's results are likely to embolden supporters of the Common Core standards that are being rolled out in 44 states and the District of Columbia. Designed to develop critical thinking skills, they spell out which math and English skills students should master in each grade.
There have been political storms in many states over the standards, which were pushed by governors who were concerned about the skill levels of their high school graduates. Opponents say the standards have a federalist bent and are untried.
Bob Wise, president of the Alliance for Excellent Education and a former governor of West Virginia, said the new national results speak to a "desperate need for the aggressive implementation" of the standards.
In reading, the 38 percent share of students performing at or above the proficient level was lower than when the assessment was first given in 1992, when it was 40 percent. Scores have remained similar since 1994.
Past comparisons in math date only to 2005. Scores had increased from 2005 to 2009.
Student participants' responses to a survey about their educational experiences offered some clues about their performance.
Among the findings:
- Students who reported rarely or never discussing reading interpretations in class averaged lower scores than those who had such discussions daily or almost daily.
- Math scores were higher, on average, for students who took calculus and lowest for students who had not taken a math course beyond Algebra I.
- Math scores were higher for students who reported that math was their favorite subject, believed it would help them in the future or thought their class was engaging.
At all levels, there continue to be racial disparities.
Among high school seniors, white and Asian students scored higher on average in the recent results in both reading and math than black, Hispanic and Native American students. Asian students scored higher than white students in math but did not do significantly better in reading. As in past years, male students did better than female students in math, but females outperformed males in reading.
The new results did not include global comparisons, but U.S. students historically do poorly on international assessments compared with many foreign peers.
Education Secretary Arne Duncan noted that despite the good news related to graduation rates and scores in younger grades, high school achievement has been flat in recent years.
"We must reject educational stagnation in our high schools, and as a nation we must do better for all," he said.
The Associated Press

Percentage of students at or above "proficient" in 12th-grade NAEP reading, by race/ethnicity
‡ Reporting standards not met. Sample size insufficient to permit a reliable estimate.
* Significantly different (p < .05) from 2013.
Source: U.S. Department of Education, Institute of Education Sciences, National Center for Education Statistics, National Assessment of Educational Progress (NAEP), various years, 1992–2013 Mathematics and Reading Assessments.
Percentage of students at or above "proficient" in 12th-grade NAEP mathematics, by race/ethnicity
* Significantly different (p < .05) from 2013.
Source: U.S. Department of Education, Institute of Education Sciences, National Center for Education Statistics, National Assessment of Educational Progress (NAEP), various years, 1992–2013 Mathematics and Reading Assessments.

Adults in Japan and across the border in Canada score much higher

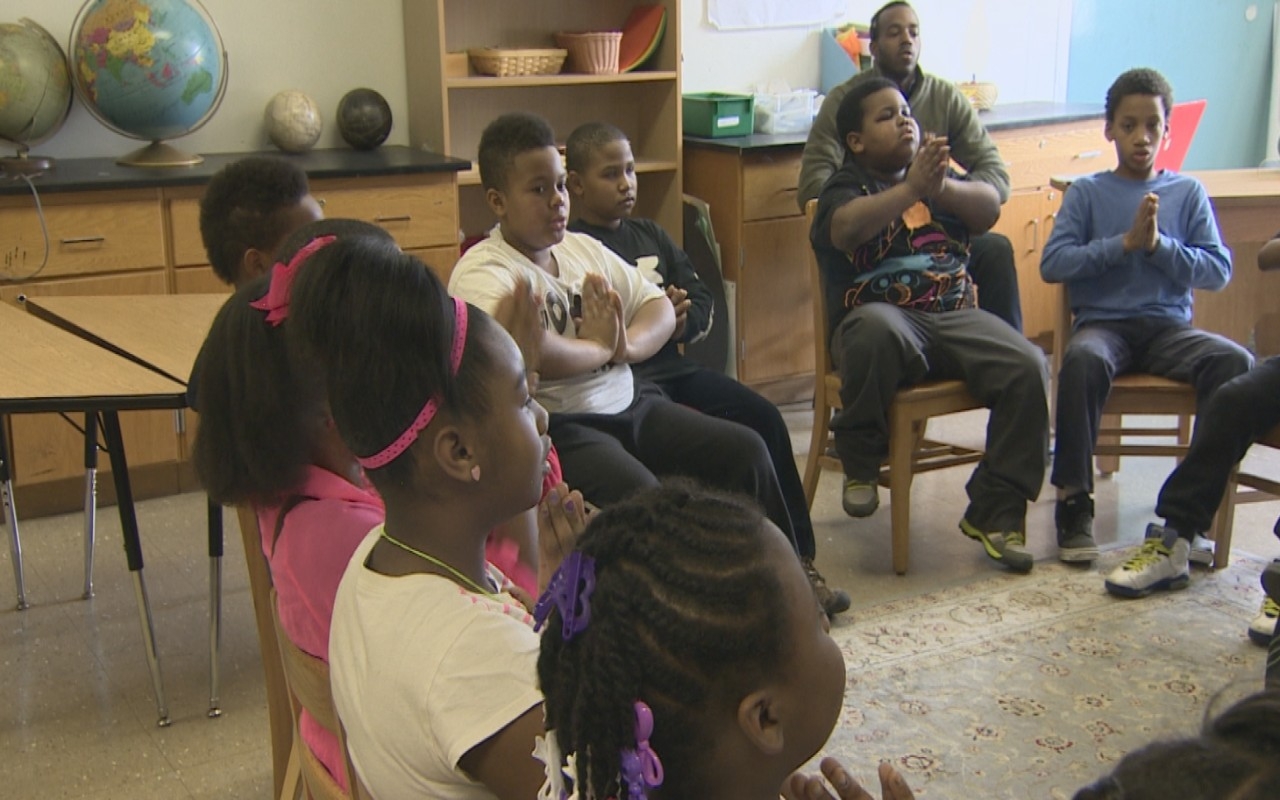
A school that was once considered to be one of the worst in the country is slowly pulling itself out of an academic emergency by targeting students' individual needs.
A school that was once considered to be one of the worst in the country is slowly pulling itself out of an academic emergency by targeting students' individual needs.


Error
Sorry, your comment was not saved due to a technical problem. Please try again later or using a different browser.